Observability in Software: Logs, Metrics & Traces

Observability is a must-have part of software development, and it shouldn't be ignored on any stage of the lifecycle. It helps you understand the system and how it behaves. More importantly, it provides answers to questions related to the current state of the system.
Observability should be considered during system design. You might not include it in the MVP, but you should plan how to add it later, otherwise, introducing observability at later stages can become complex, costly, and error-prone.
Questions
When developing software, you should be able to answer questions such as:
- Are the services available?
- How many RPS (requests per second) can the system withstand?
- What is RT (response time) of different parts of the system? How long does user need to wait before a request is processed?
- Are there any traffic peaks when system is under heavy load?
- When does system performance degrade?
- Which part of system is the bottleneck?
- Why some requests fail?
- Which HTTP status codes does system return? What is the ratio of 4xx/5xx responses compared to 2xx?
- Which part of the system should be optimized first?
As you can see, there are many questions you need to ask when developing software. Nothing provides better insights than the system itself.
Example
For example, imagine you're developing an online store with multi-step order flow that includes stock reservation, order creation and communication with a bank. Suddenly, there're no orders for quite long period of time and you have also received some negative emails from customers. You check website and try to place an order, but it fails with an unknown error.
As you remember, the order flow is quite complex and without any observability it would be tough task to find what's broken and what needs to be fixed.
Possible reasons for the failure could include:
- Network issues preventing services from communication with each other
- Database being down or running out of space
- The bank blocking your account
- Requests timing out
- The application being unavailable
Observability is a powerful tool that helps you understand how an application works and makes its behavior more predictable. There're three main pillars (logging, tracing, and metrics) which together provide most of what is needed to effectively observe and operate modern applications.
Logging
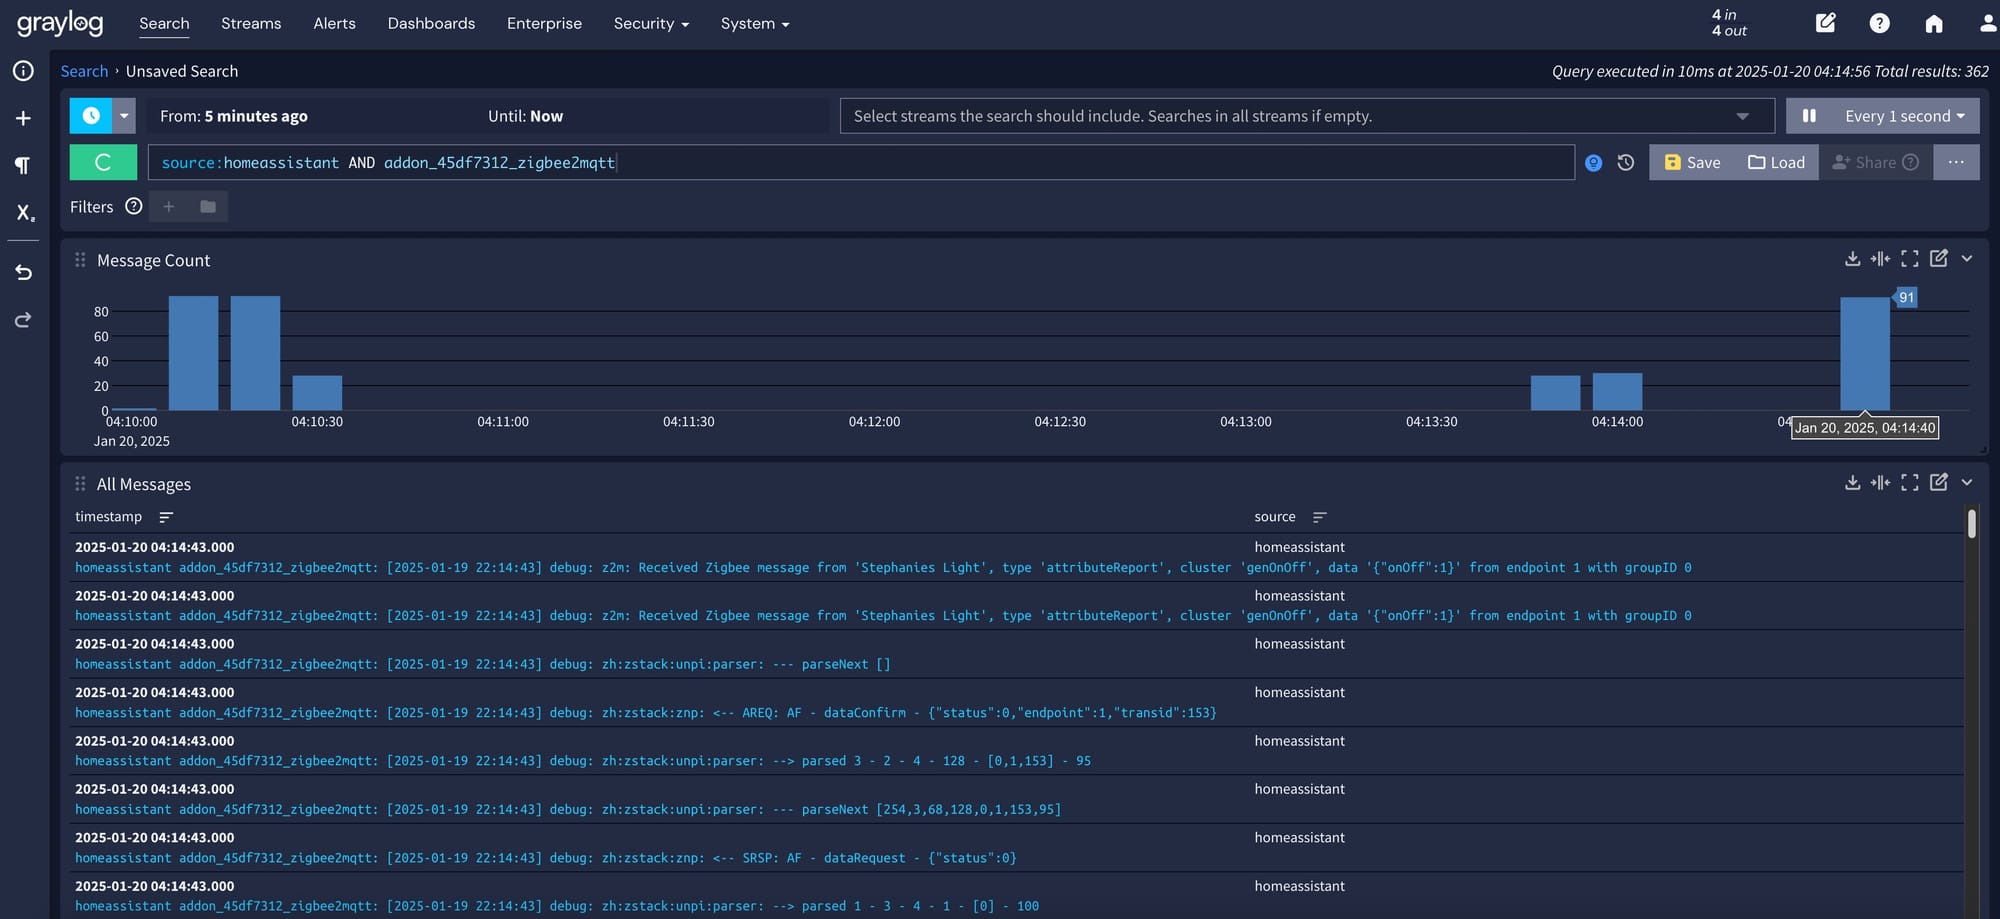
Logging is the most well-known part of observability, and it's widely used across various applications. It provides a detailed description of events in the system. Usually, a log contains log event ID, timestamp, log event level, message and custom details.
Log types
Logs are divided into two types:
- Unstructured (plain text) - stored as raw text
- Structured - data object with defined serialization format (for example, JSON). Structured logs allow faster querying and often reduce storage costs
Log levels
Log levels describe the severity of a log entry. They're usually used for filtering and can be enabled or disabled at runtime. For example, the DEBUG level can be enabled for a short period of time to observe specific request pipeline.
Log levels, from lowest to highest severity (more verbose → fewer events):
- TRACE - every step of a process (
method invocation,method returned) - DEBUG - diagnostic information (
method arguments,intermediate values) - INFO - application lifecycle and business events (
order created,user logged in) - WARN - unexpected situations that do not break the application (
order not found,retries) - ERROR - failed operations (
failed to process order,failed to accept payment) - FATAL - application is unusable or near failure (
database unavailable,thread exhaustion,high memory usage)
Best practices
Best practices when to log:
- Log every exception (ERROR level)
- Log unexpected situations (WARN level)
- Log events that may help with incident investigation (INFO level)
- Use DEBUG logs when an issue can't be reproduced locally or in staging
- Avoid logging high-volume events, as they consume significant storage
- Never log sensitive data, such as customer names, addresses, identification numbers, or phone numbers
Log creation and collection must never block or slow down business-critical application logic.
Example
For example, customer can't place an order and receives a 5xx error code, it usually means that application threw an exception. This exception should be logged at the ERROR level. We can then analyze the log details to diagnose the issue and decide how to fix it.
Logging is especially useful when you need to deep dive into the details of each event in the system. This observability pillar is the most verbose among the others.
Tracing
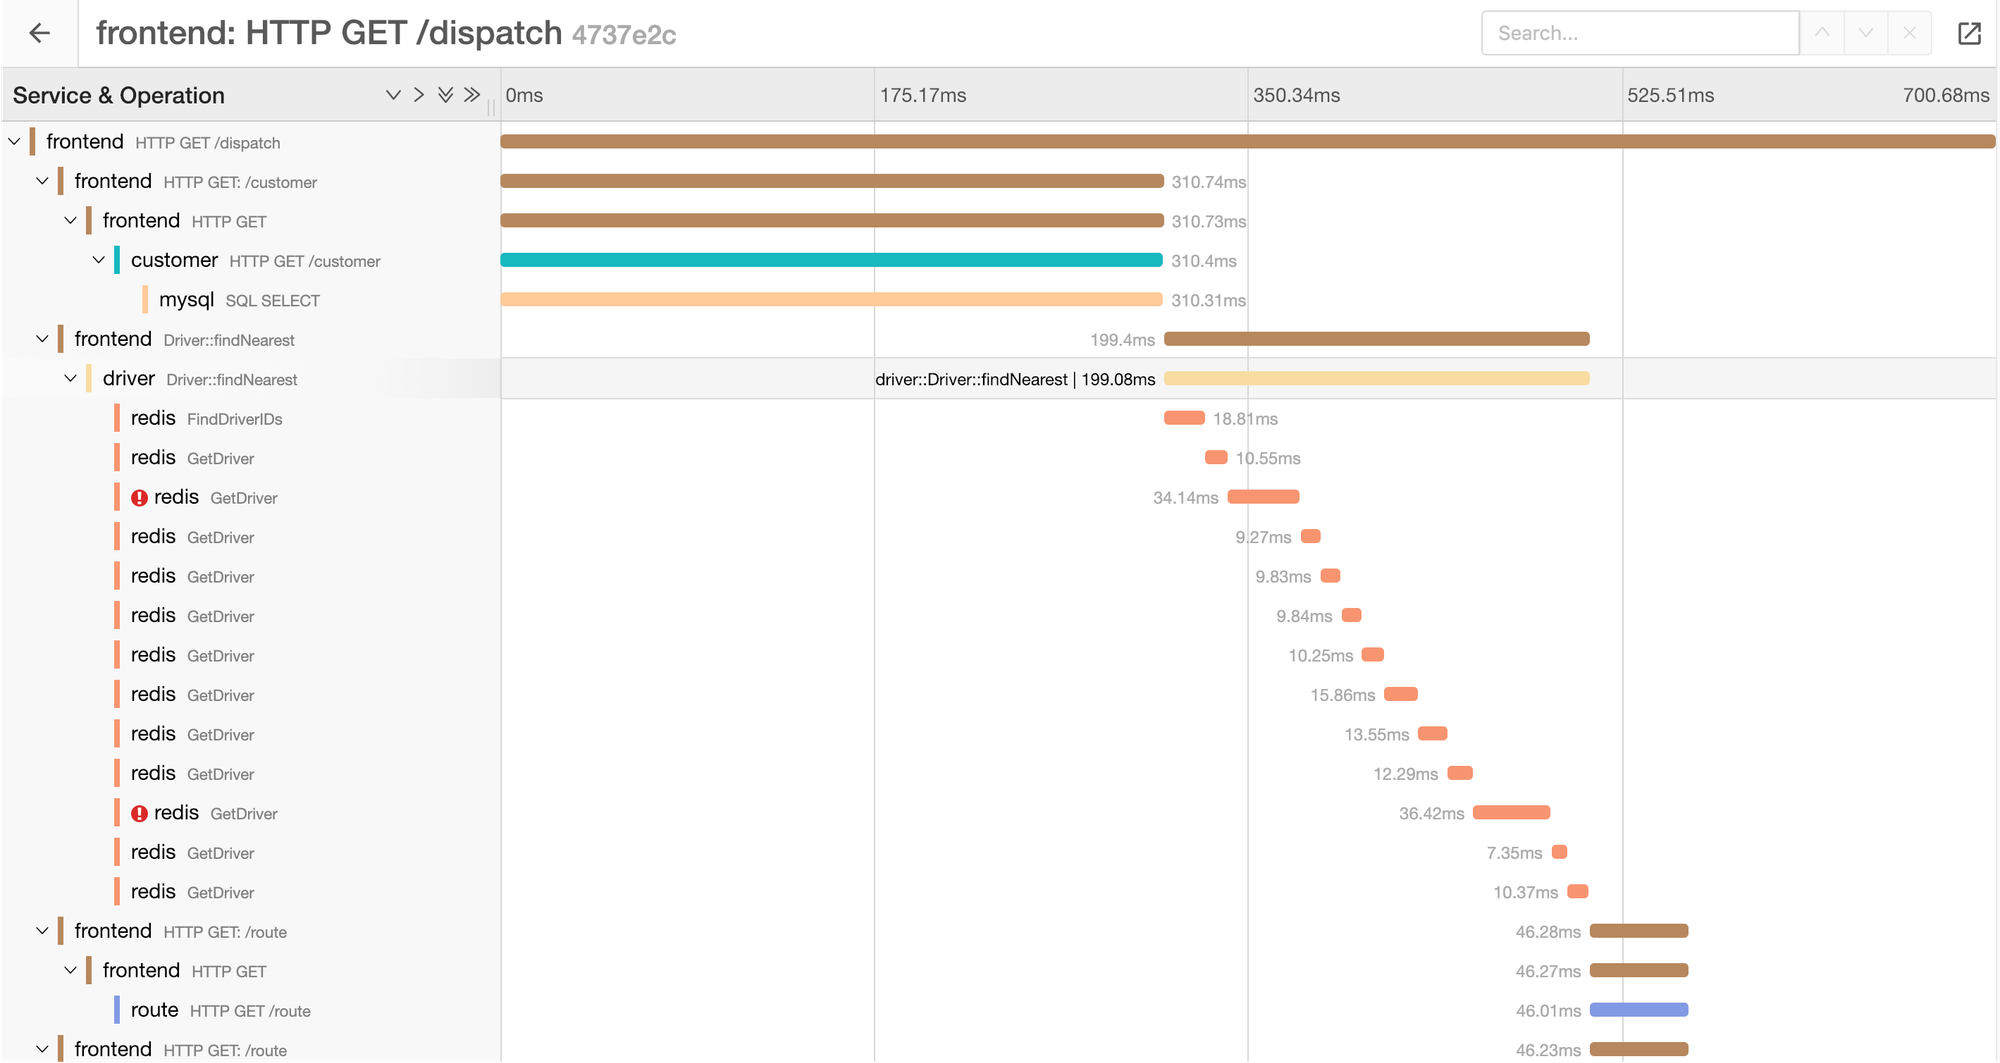
Tracing is another pillar of observability and the most complex one as all services must support tracing in request pipeline. It is used primarily in complex distributed systems, where you need to understand the exact data flow of a request across multiple services and their dependencies, as well as response time of each step.
Each trace contains unique ID, which correlates multiple spans into one a single request lifecycle.
Use cases
Tracing can be used to analyze:
- Which requests exceedes SLO (95th percentile latency < 50ms)
- Which requests fail, along with correlated logs
- Which part of request consumes the most response time
- Dependencies between services involved in a request
Trace structure
A single incoming request creates unique trace ID and root span.
When the request calls another service, the trace ID is propagated (via headers) and a child span is created.
Trace ID: 885bef8bbc18649c
 ├─ Root span: HTTP POST /orders
 │    ├─ Span: StockService.Reserve
 │    ├─ Span: MoneyService.MakePayment
 │    └─ Span: OrdersService.CreateOrder
│ └─ Span: DB queryMultiple traces can be linked, but they remain independent.
How traces are collected
Applications create spans and traces locally, then export them to a tracing backend directly or via an intermediate collector.
Only completed spans are exported. Incomplete or in-flight requests are not sent
Tracing is especially useful when you need to understand end-to-end request latency, cross-service dependencies, and performance bottlenecks in distributed systems - something that logs or metrics alone cannot fully explain.
Metrics
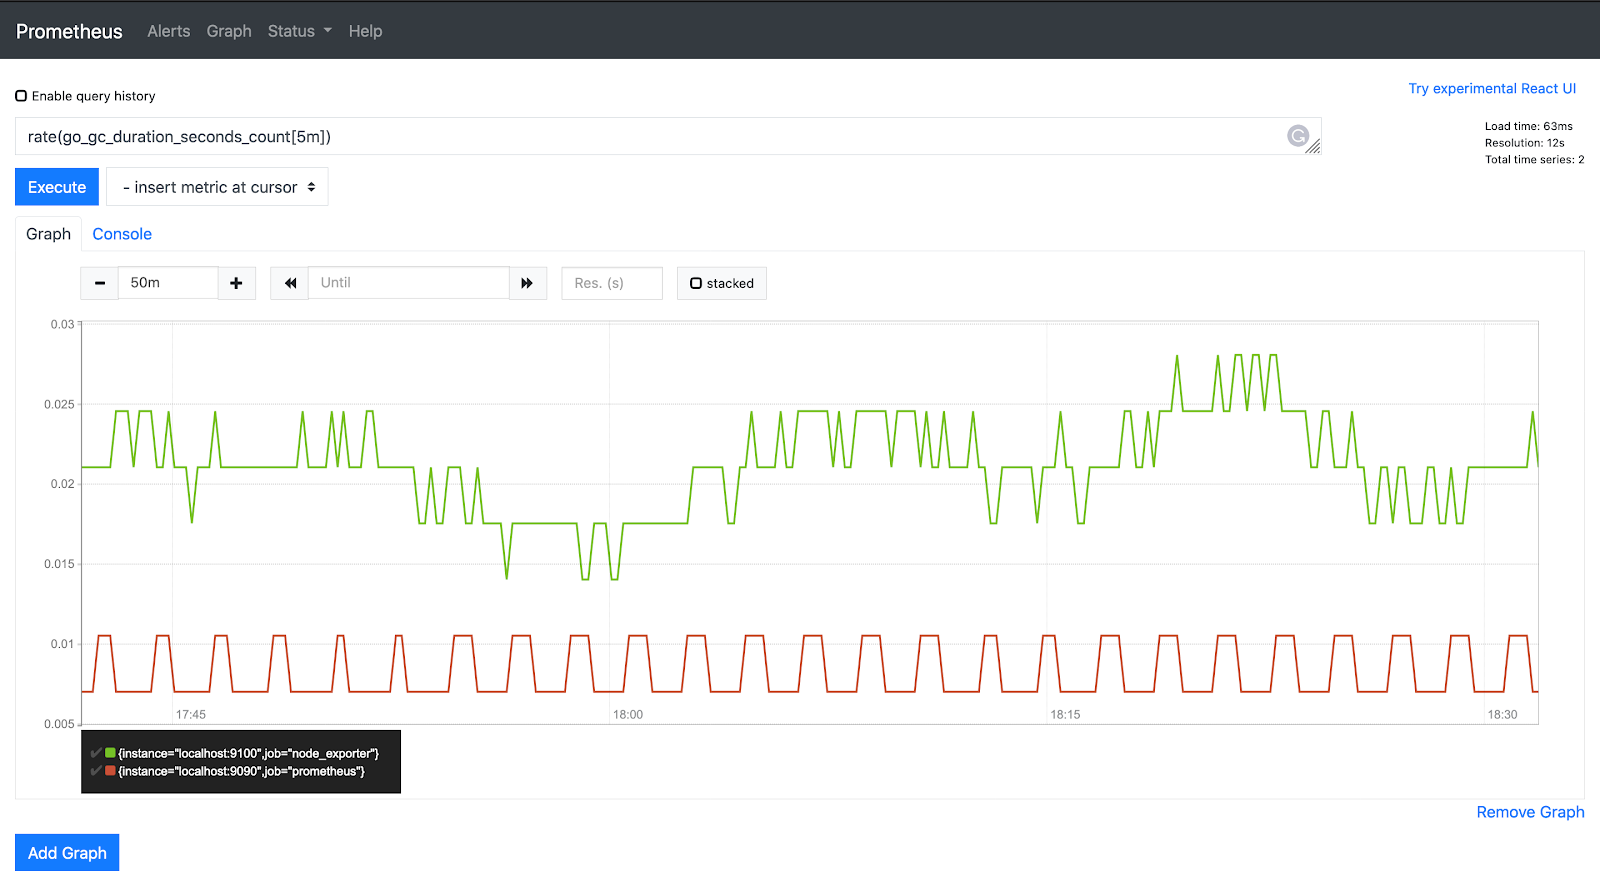
Metrics is the most useful pillar of observability for understanding how an application operates over time. They provide aggregated and cumulative information about system behavior, but do not contain details about individual events.
Metric types
There are different types of metrics that are not interchangeable and must be used depending on the use case:
- Counter - a monotonically increasing value (
number of requests,number of created orders) - Gauge - a value at a specific point of time that can increase and decrease (
memory usage,number of active users) - Histogram - a distribution of values across predefined buckets (
request latency,order cost) - Summary - similar to a histogram, but quantiles are calculated on the client side
How metrics are collected
There're two main strategies:
- Pull - preferred approach
Exporters periodically scrape metrics from a specific endpoint (usuallymetrics) and upload them to metrics backend. The pull model provides a single point of synchronization, which helps avoid race conditions. - Push - should be used only when Pull strategy is not suitable
The application pushes metrics directly to metrics backend. This approach is typically used for short-lived jobs, which push metrics at the end of their processing pipeline.
Visualization
Once metrics are collected, they can be visualized in a UI (most commonly Grafana) using predefined dashboard.
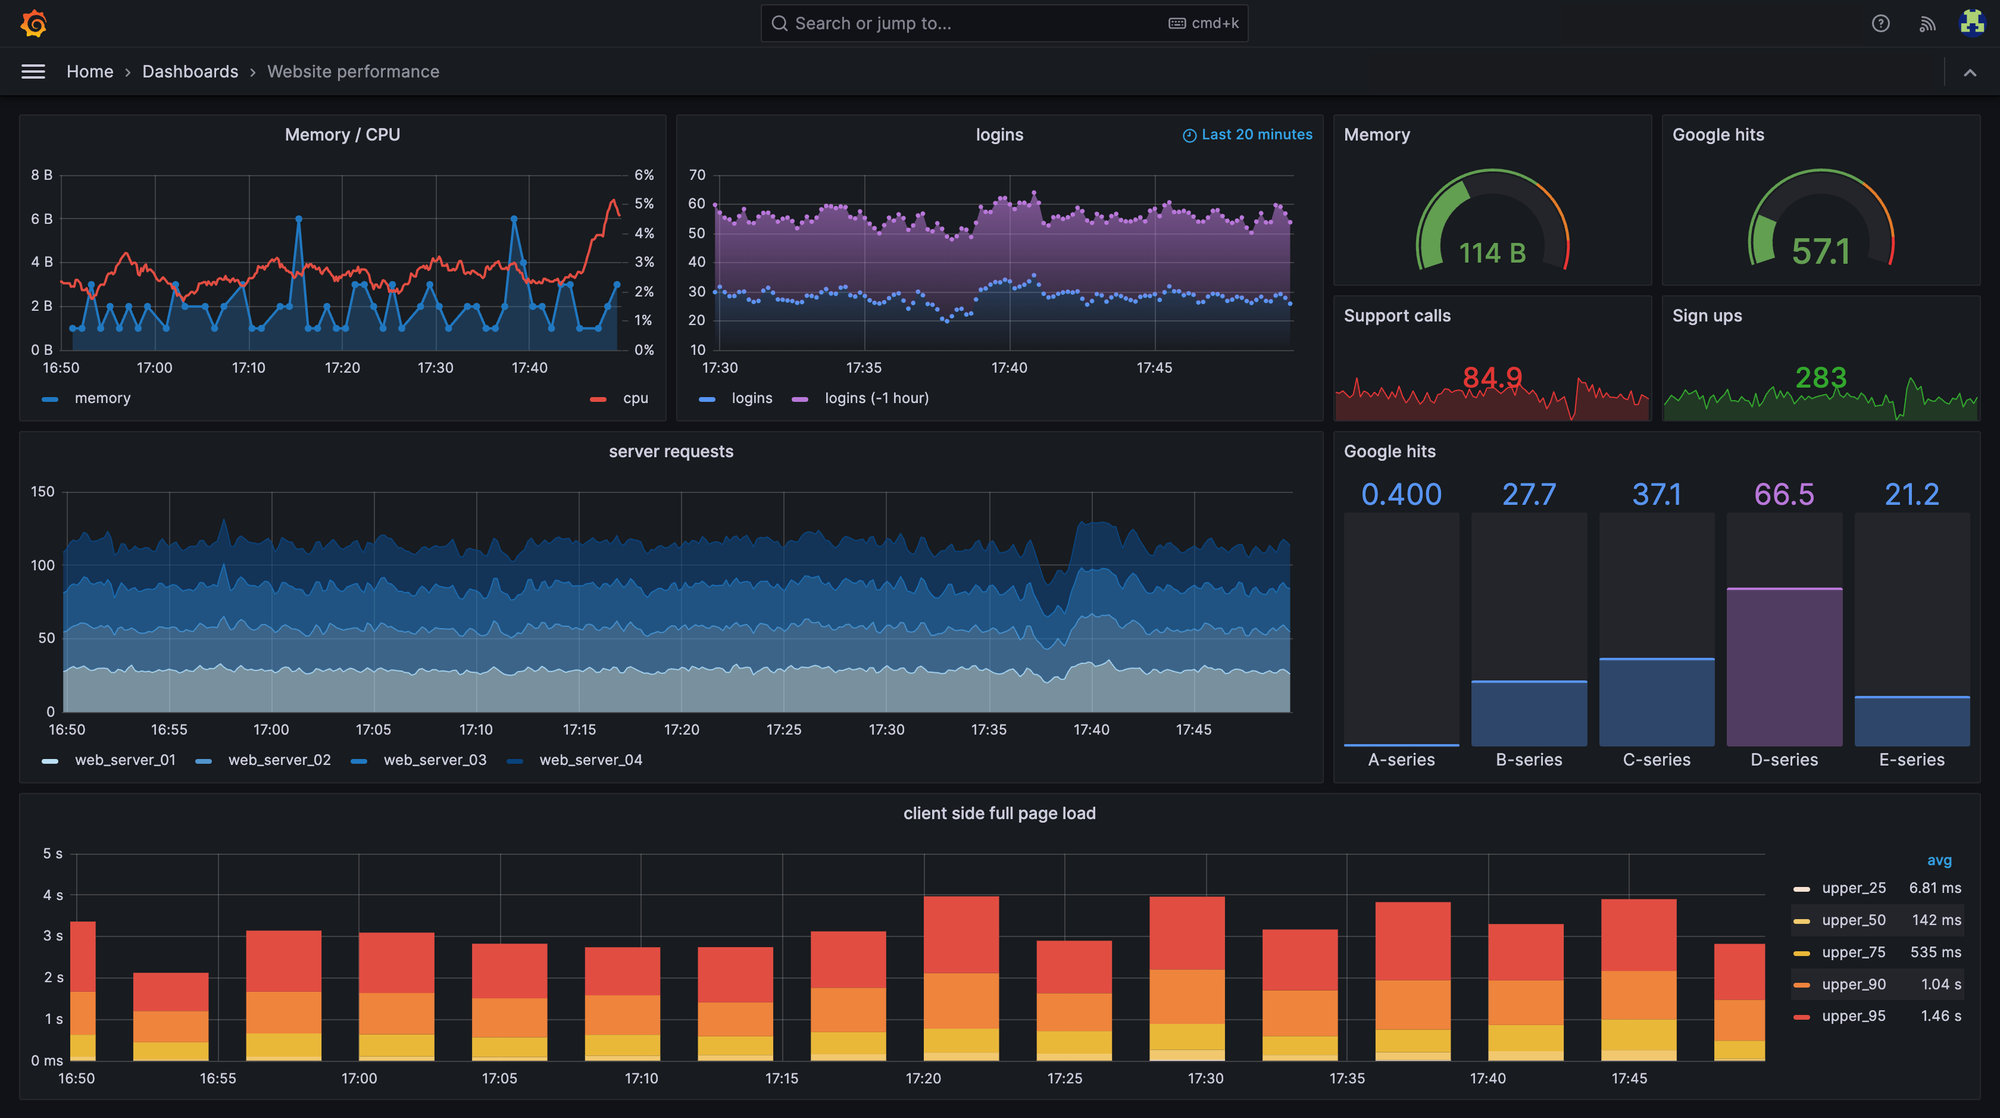
Alerts
Metrics allow you to detect abnormal situations and notify developers automatically through various channels (phone calls, messengers, application notifications or email), enabling faster incident response.
An alert can be configured with conditions such as:
- Memory usage exceeds 95%
- The condition persists for 5 minutes
If all conditions are met, the alert is triggered, and a notification is sent.
Example
Suppose we add a metric that increments a counter every time an order is created. This metric allows us to see how many orders are created over time.
Using this data, we can determine how many orders were created in the last 10 minutes (or any other time window).
If the application is expected to run 24/7 and orders should be created continuously, we can configure an alert to detect when no orders have been created for the past 5 minutes (or when the rate drops below the expected threshold).
This alert is high-level and does not explain why the problem occurred. Possible reasons could include:
- The website is unavailable
- Network issues between services
- External dependencies are down
To improve observability, you can also configure more specific alerts. For example, if an external dependency becomes unavailable, you can increment a dedicated metric and trigger a targeted alert.
OpenTelemetry

OpenTelemetry is the de facto observability standard in modern software development. It is a collection of APIs, SDKs, and tools used to generate, collect, and export telemetry data - metrics, logs, and traces.
The problem
The observability landscape is highly fragmented. There are many monitoring systems for logs, metrics, and traces, each with its own data formats, APIs, agents, and visualization tools.
In large technology companies, this quickly becomes a serious issue: different teams, infrastructures, and open-source applications rely on different vendors, each requiring its own tooling and operational expertise.
As a result, organizations end up with a technology zoo that is costly to maintain and difficult to evolve. Despite these differences, all these systems essentially solve the same problem - collecting and visualizing telemetry data to understand system behavior.
The standard
OpenTelemetry addresses this fragmentation by standardizing how applications generate, collect, and export telemetry data, as well as defining common semantic conventions and data formats.
By adopting OpenTelemetry, observability becomes vendor-neutral. Applications are instrumented once and can export telemetry to any compatible backend. This eliminates vendor lock-in and allows teams to switch or add monitoring backends without modifying application code.
Summary
Observability is a critical capability in modern software development that cannot be ignored at any stage of the system lifecycle. It enables teams to understand system behavior, assess its current state, and answer essential questions about availability, performance, and failures.
Modern observability relies on three complementary pillars: logging, tracing, and metrics. Together, they provide deep visibility:
- Logs capture detailed events
- Traces explain end-to-end request flows across services
- Metrics reveal aggregated trends and enable alerting
As systems grow, the observability ecosystem becomes fragmented, creating a costly technology zoo of incompatible tools, formats, and vendors. OpenTelemetry solves this fragmentation by defining a vendor-neutral standard for generating, collecting, and exporting telemetry data. With OpenTelemetry, applications are instrumented once and can send data to any compatible backend, eliminating vendor lock-in and simplifying observability at scale.
Member discussion